74
CIMIC Group Limited Annual Report 2016 |
Sustainability Report
74
•
enforced efficiency routines including regular maintenance of plant and no idling policies for heavy plant.
Scope Two reductions have been achieved through:
•
design optimisation which reduced the tunnel diameter, reducing the quantity of materials to be removed and sent offsite, and
reducing the volume of concrete used in each segment of panel lining the tunnel; and
•
reduced electricity associated with segment production and handling.
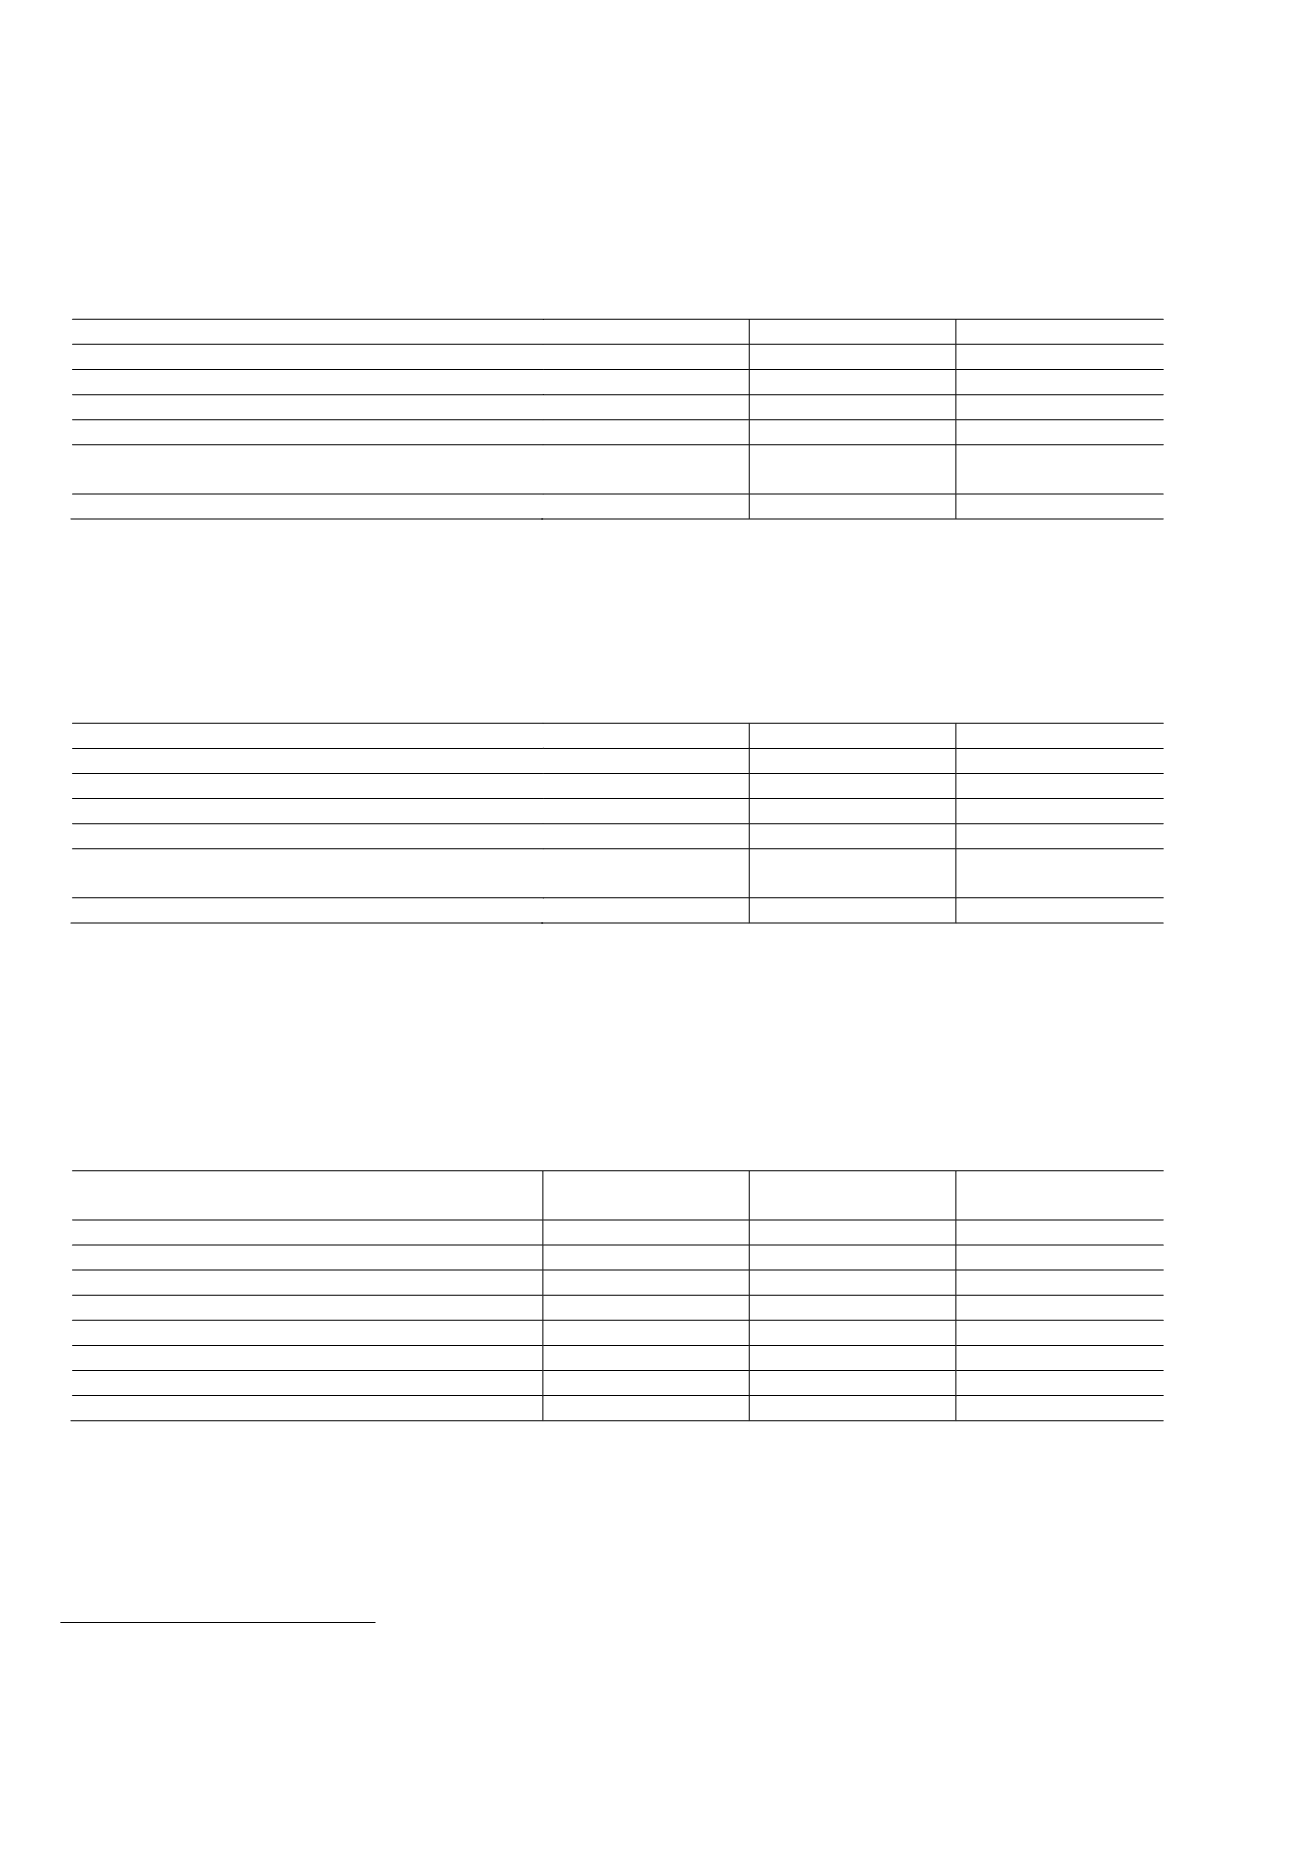
Scope Two greenhouse gas emissions (kt.CO2-e)
2016
2015
CPB Contractors
29
41
Leighton Asia
31
36
Thiess
20
15
Sedgman
1
-
Other (including CIMIC, Pacific Partnerships, EIC
Activities, Leighton Properties, Devine)
7
7
Total
89
100
Scope Three includes other indirect emissions, such as:
•
the extraction and production of purchased materials such as concrete, asphalt and steel;
•
fuel for transport-related activities in vehicles not owned or controlled by the Group;
•
electricity-related activities not covered in Scope Two;
•
outsourced activities; and
•
waste disposal.
Scope Three greenhouse gas emissions (kt.CO2-e)
2016
2015
CPB Contractors
1,848
606
Leighton Asia
1,572
2,882
Thiess
1
8
Sedgman
1
-
Other (including CIMIC, Pacific Partnerships, EIC
Activities, Leighton Properties, Devine)
1
1
Total
3,423
3,497
We are registered to report under Australia’s
National Greenhouse and Energy Reporting Act 2007
(Cth) (NGER). Energy use and
emissions data is collected for all Company projects and sites irrespective of the operational control status. The Group has comprehensive
measures in place to manage its Australian NGER obligations including:
•
having established legal review processes to identify operational control
51
status at the tender and contract stages;
•
utilising Group-wide accounting systems to manage all data; and
•
having the Group’s data and processes subjected to annual external assurance audits.
The Group has reported the following emissions and energy usage NGER data:
Greenhouse gas emissions and energy consumption
52
Total Scope One
emissions (t CO2-e)
Total Scope Two
emissions (t CO2-e)
Total Net energy
consumed (GJ)
2015/16
53
45,260
32,910
807,792
2014/15
77,412
72,142
1,434,467
2013/14
153,239
92,522
2,604,328
2012/13
206,245
128,495
2,660,483
2011/12
730,542
132,516
6,918,762
2010/11
775,441
187,887
8,435,737
2009/10
684,758
243,487
7,811,131
2008/09
478,444
114,785
5,278,962
EY provided a limited assurance audit in 2016 and signed off on the preparation of CIMIC’s Energy and Emissions Report.
51
'Operational control' is the concept used when determining the corporate group which has NGER obligations for the facility.
52
National Greenhouse and Energy Reporting figures are for where the Group has ‘Operational control’ for the facility as per the NGER definition and are
for Australian operations only.
53
Reported to NGER, expected to be published by the Clean Energy Regulator at the end of Feb 2017.
74


